Dashboard
Monitor AI spend, value delivery, routing savings, and token consumption from the FinOps dashboard.
The Dashboard under Finops Config gives executives and FinOps admins a single view of AI economics across your organization.
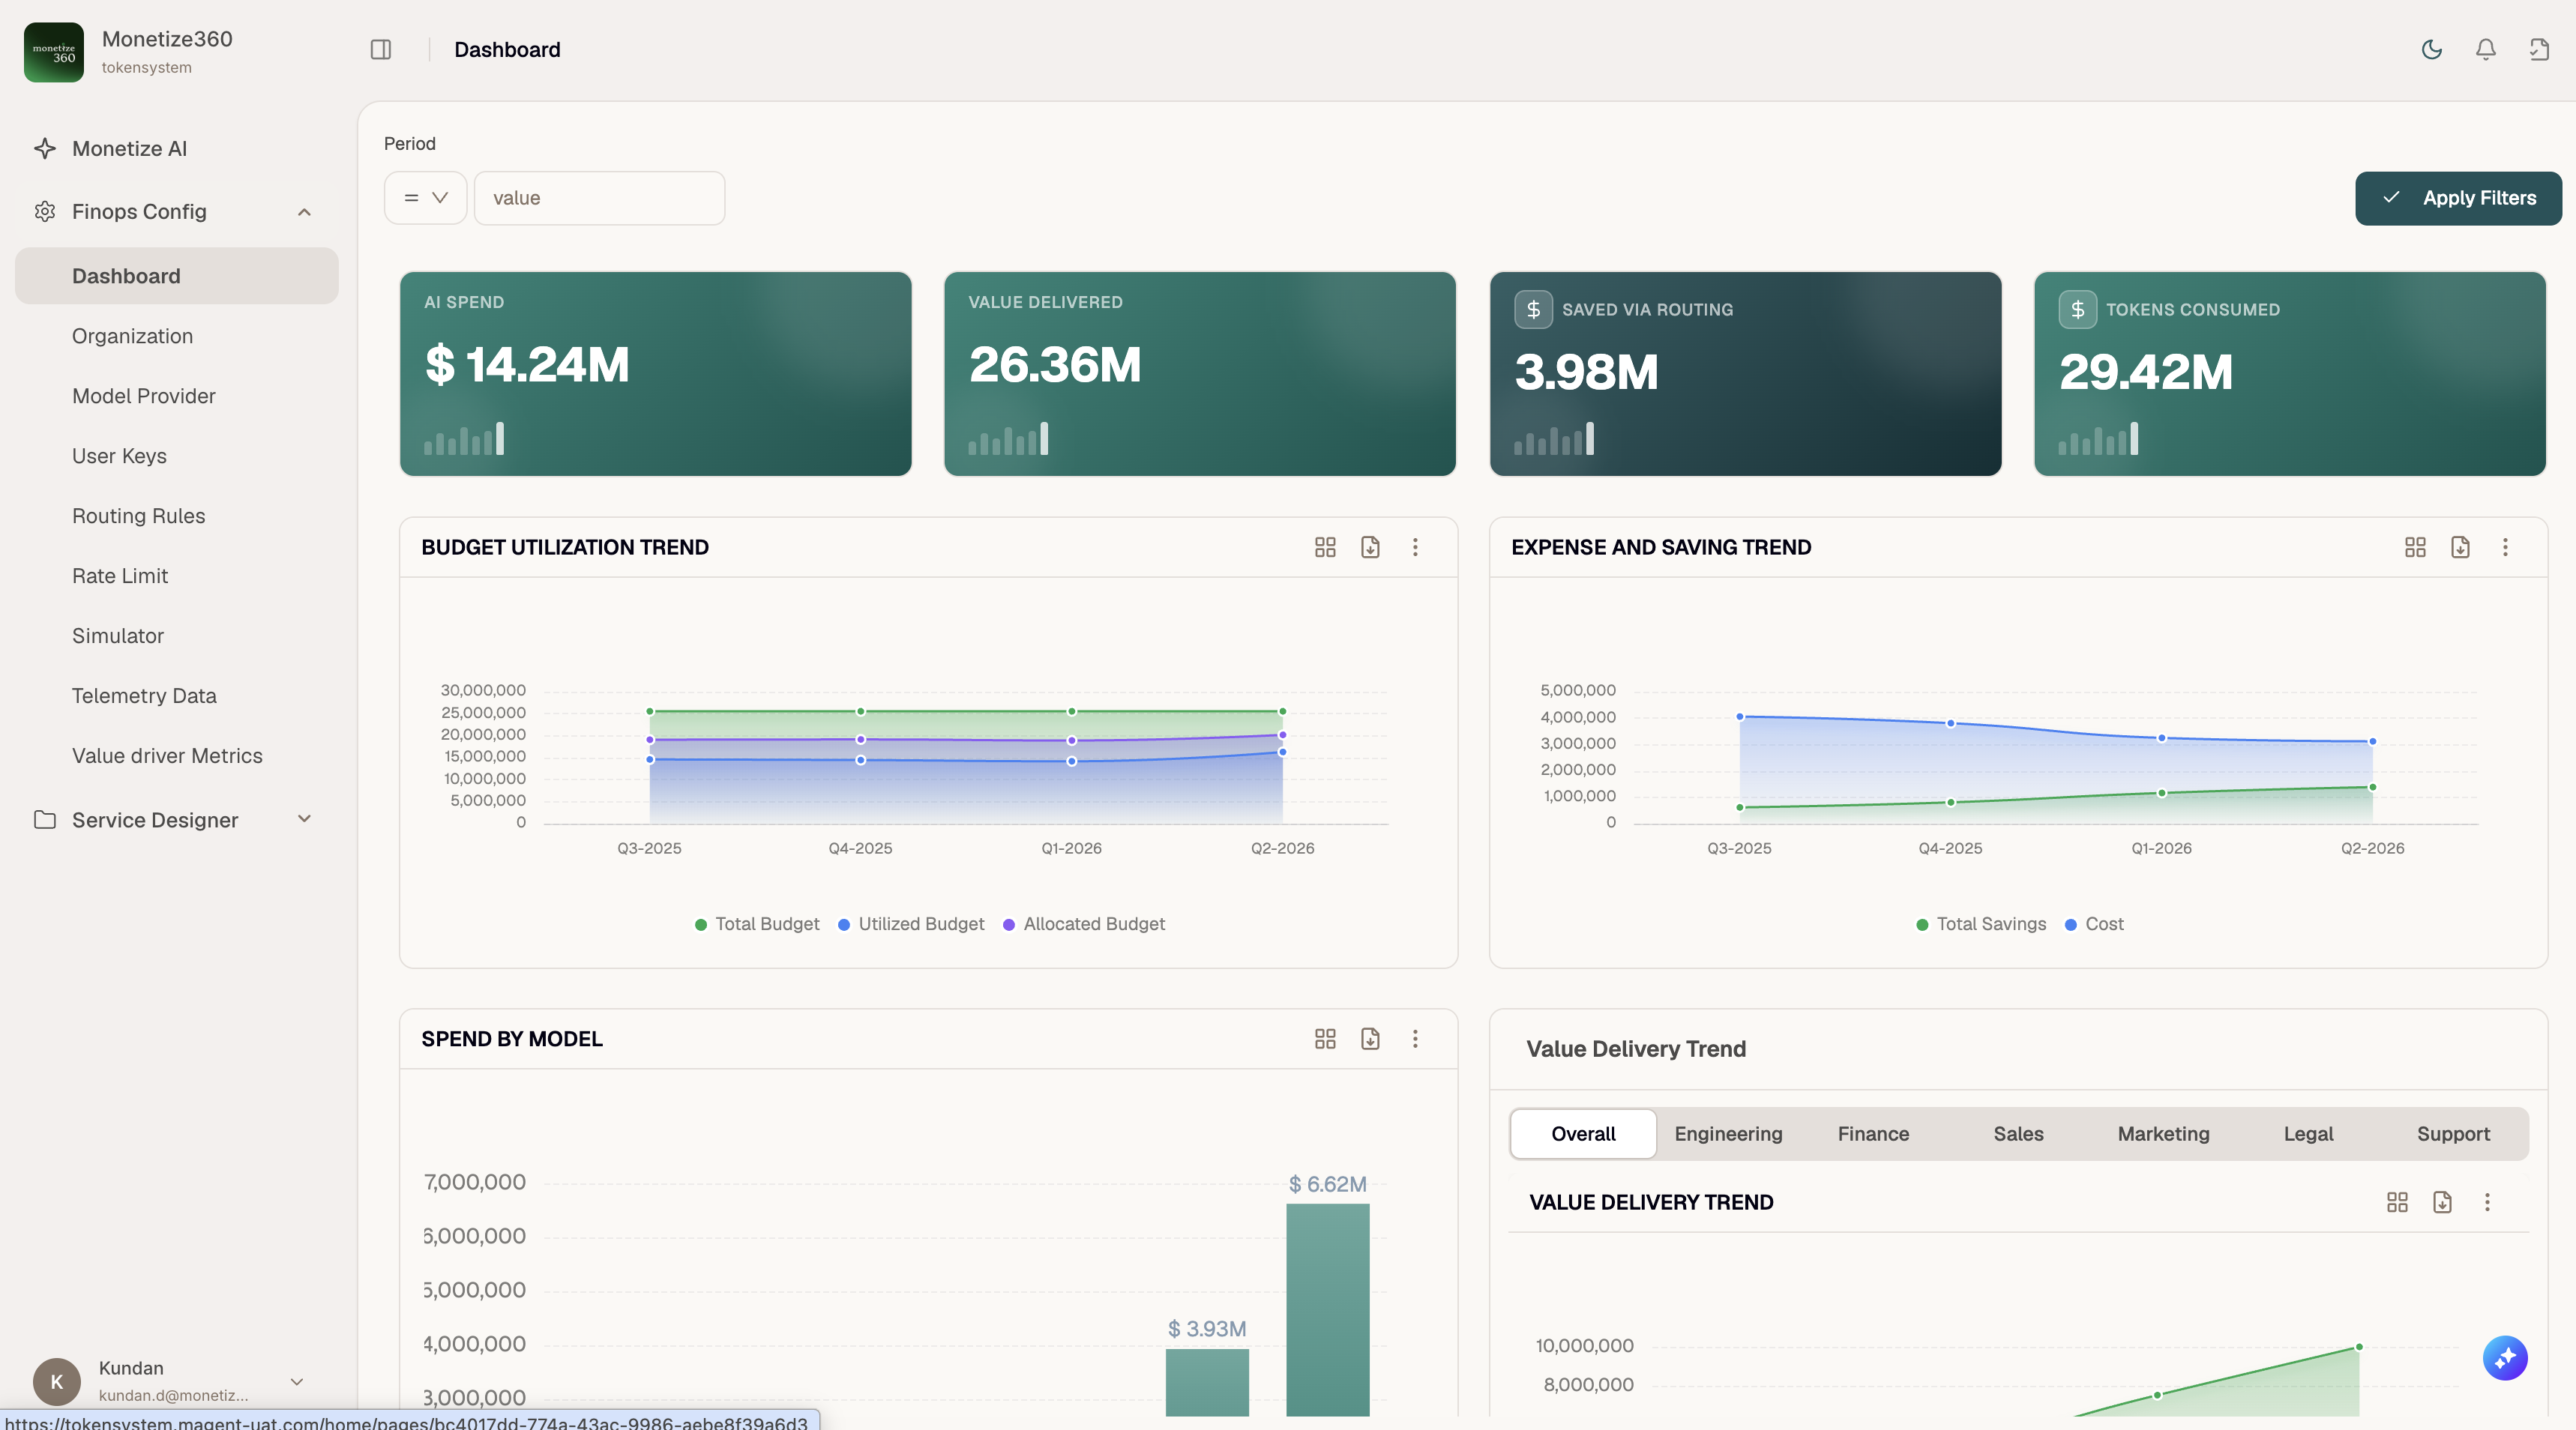
KPI cards
| Metric | Description |
|---|---|
| AI Spend | Total cost of AI inference across all providers and models in the selected period |
| Value Delivered | Business value attributed to AI usage (from value-driver metrics) |
| Saved via Routing | Cost avoided by routing requests to cheaper or preferred models |
| Tokens Consumed | Aggregate input and output tokens processed through the gateway |
Each card includes a sparkline for quick trend context.
Charts
Budget Utilization Trend
Tracks Total Budget, Utilized Budget, and Allocated Budget over time. Use this to spot departments or entities approaching their caps before hard blocks occur.
Expense and Saving Trend
Compares Cost against Total Savings from intelligent routing and model selection.
Spend by Model
Bar chart of spend broken down by model. Identify which models drive the majority of cost.
Value Delivery Trend
Line chart of value delivered over time. Use the department tabs — Overall, Engineering, Finance, Sales, Marketing, Legal, Support — to drill into team-level contribution.
Filters
Use the Period filter at the top of the page, then click Apply Filters to refresh all widgets for the selected date range.
Related pages
- Telemetry Data — row-level token consumption
- Value Driver Metrics — configure how value is measured
- Organization → Budget — set the budget limits reflected in utilization charts