Token Factory
Budget
How the token budget is split across departments, and who uses the most of it.
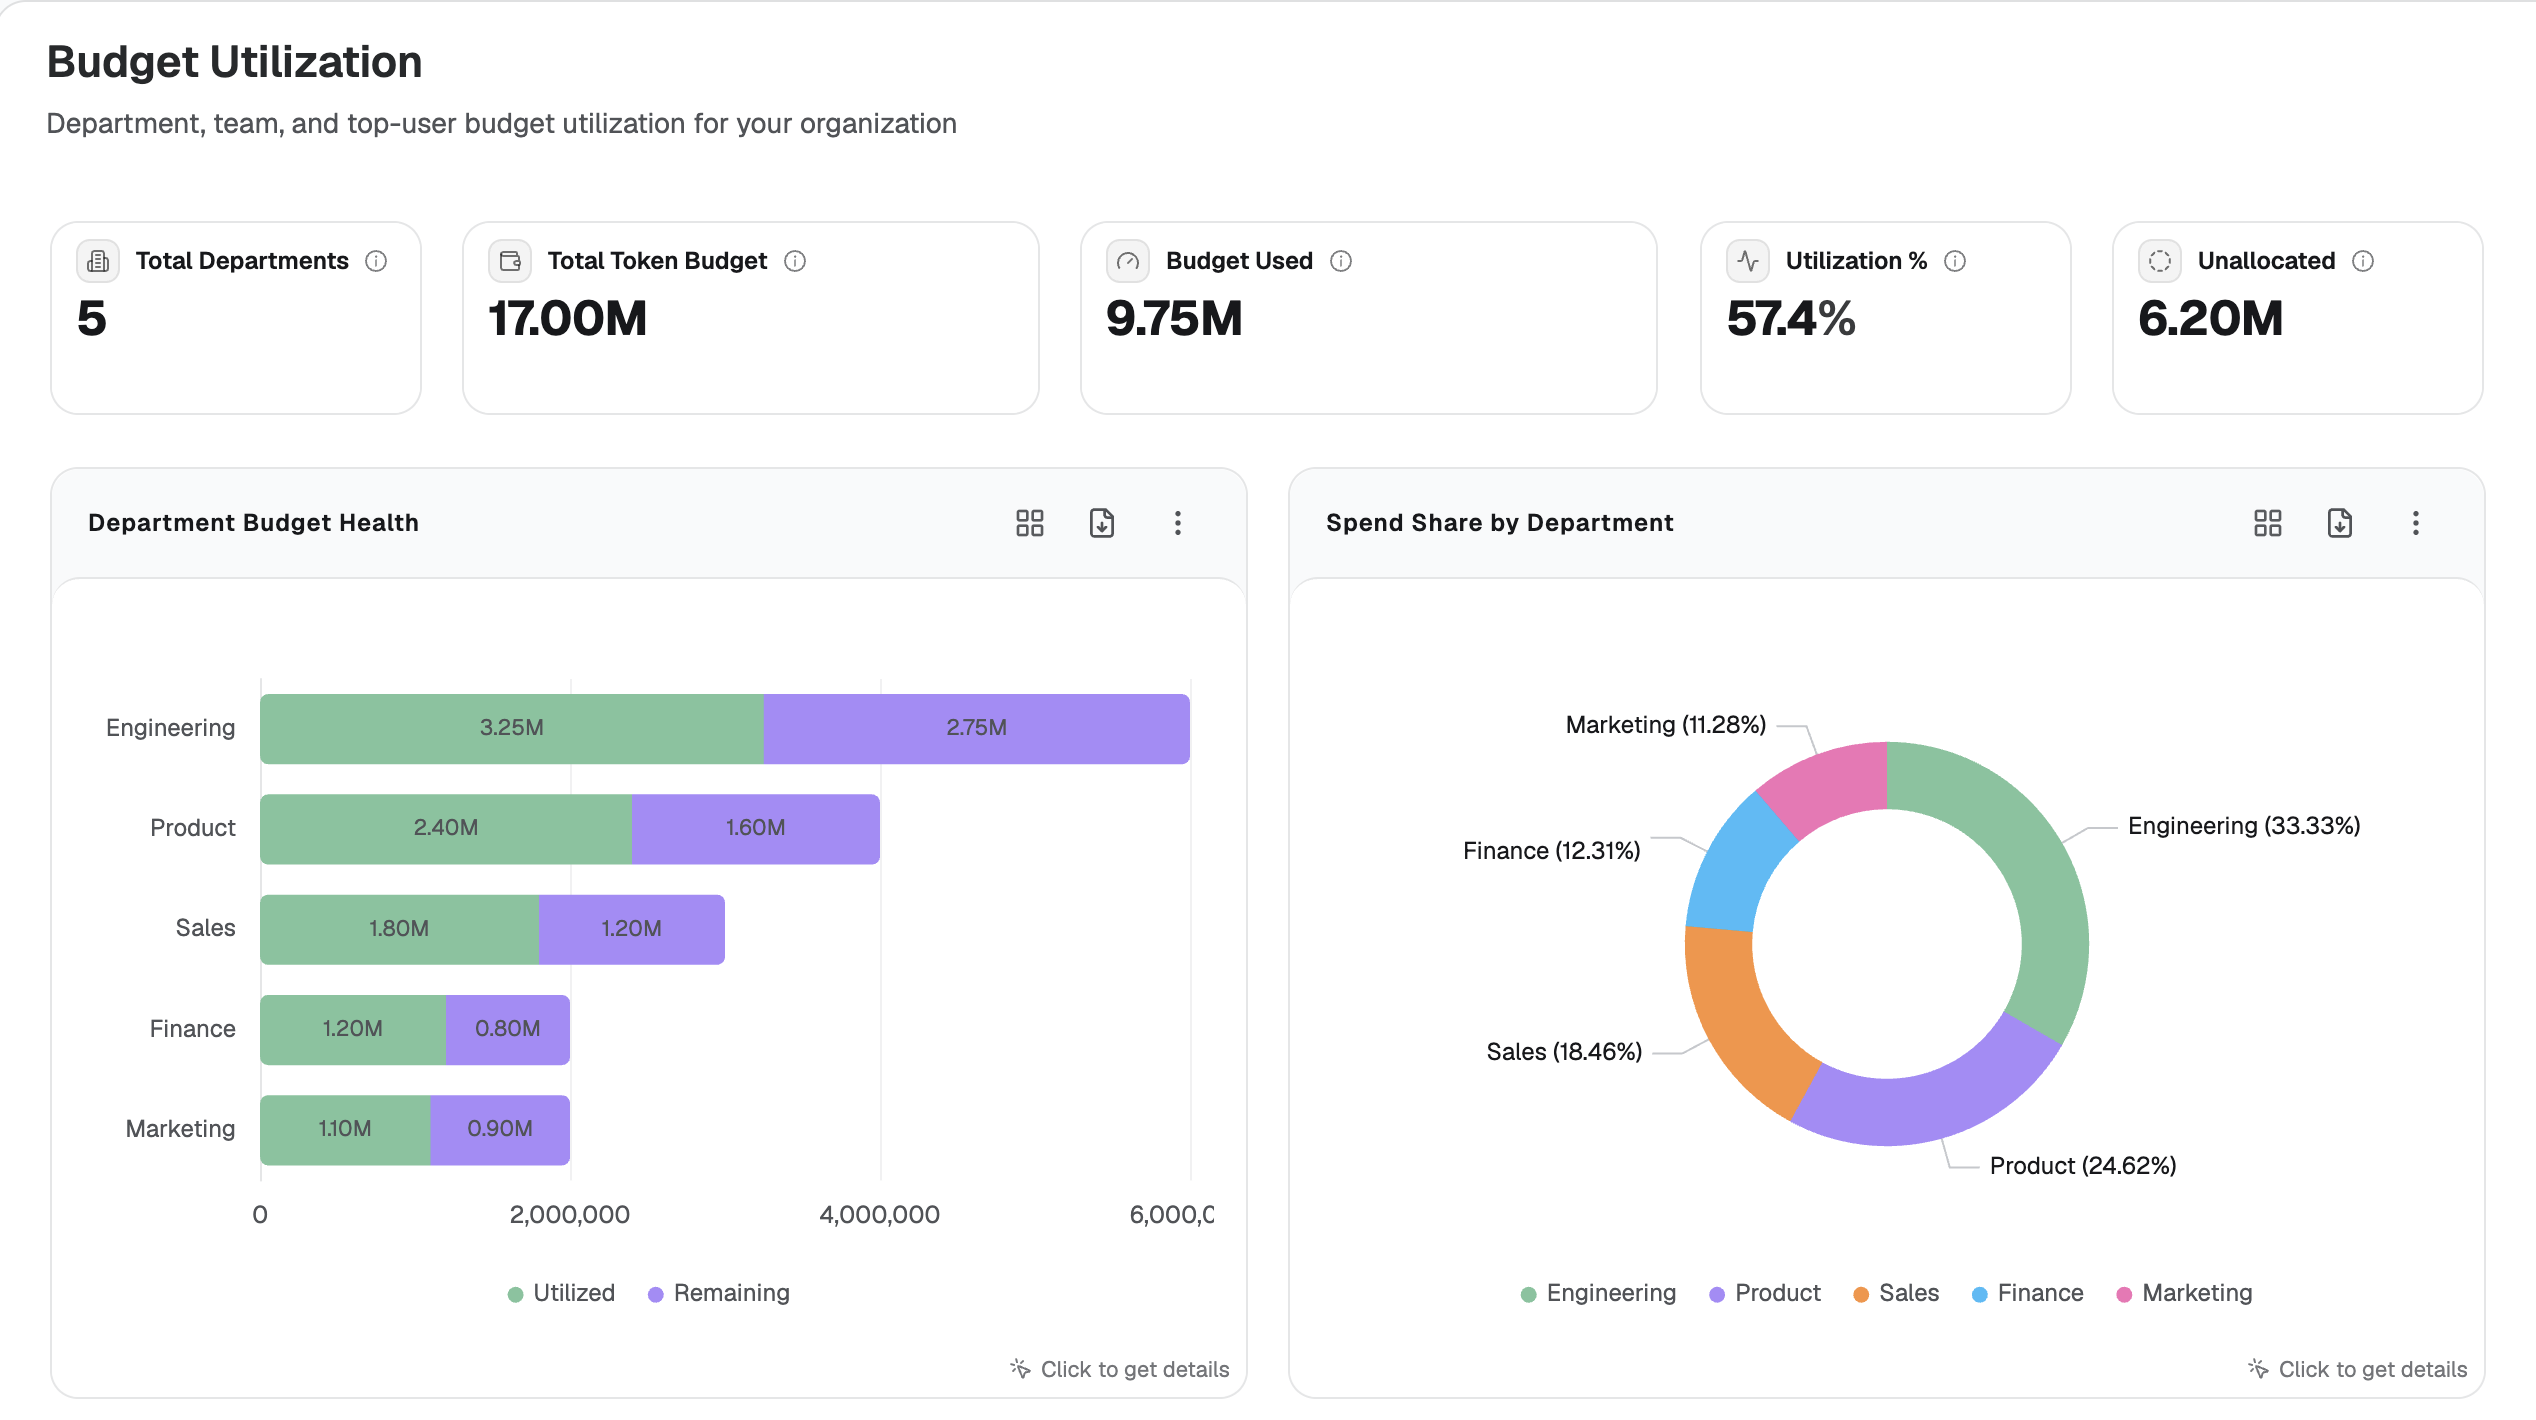
Budget utilization shows how the token budget is split across departments and how much of it has been used.
The summary shows:
- How many departments exist
- The total token budget and how much of it is used
- The usage ratio
Example from a sample account: a total token budget of 16 million, with 9.7 million already used.
Open the department breakup to see, for each department:
- Budget allocated
- Amount utilized
- Remaining budget
The same area also shows department-wise spend.
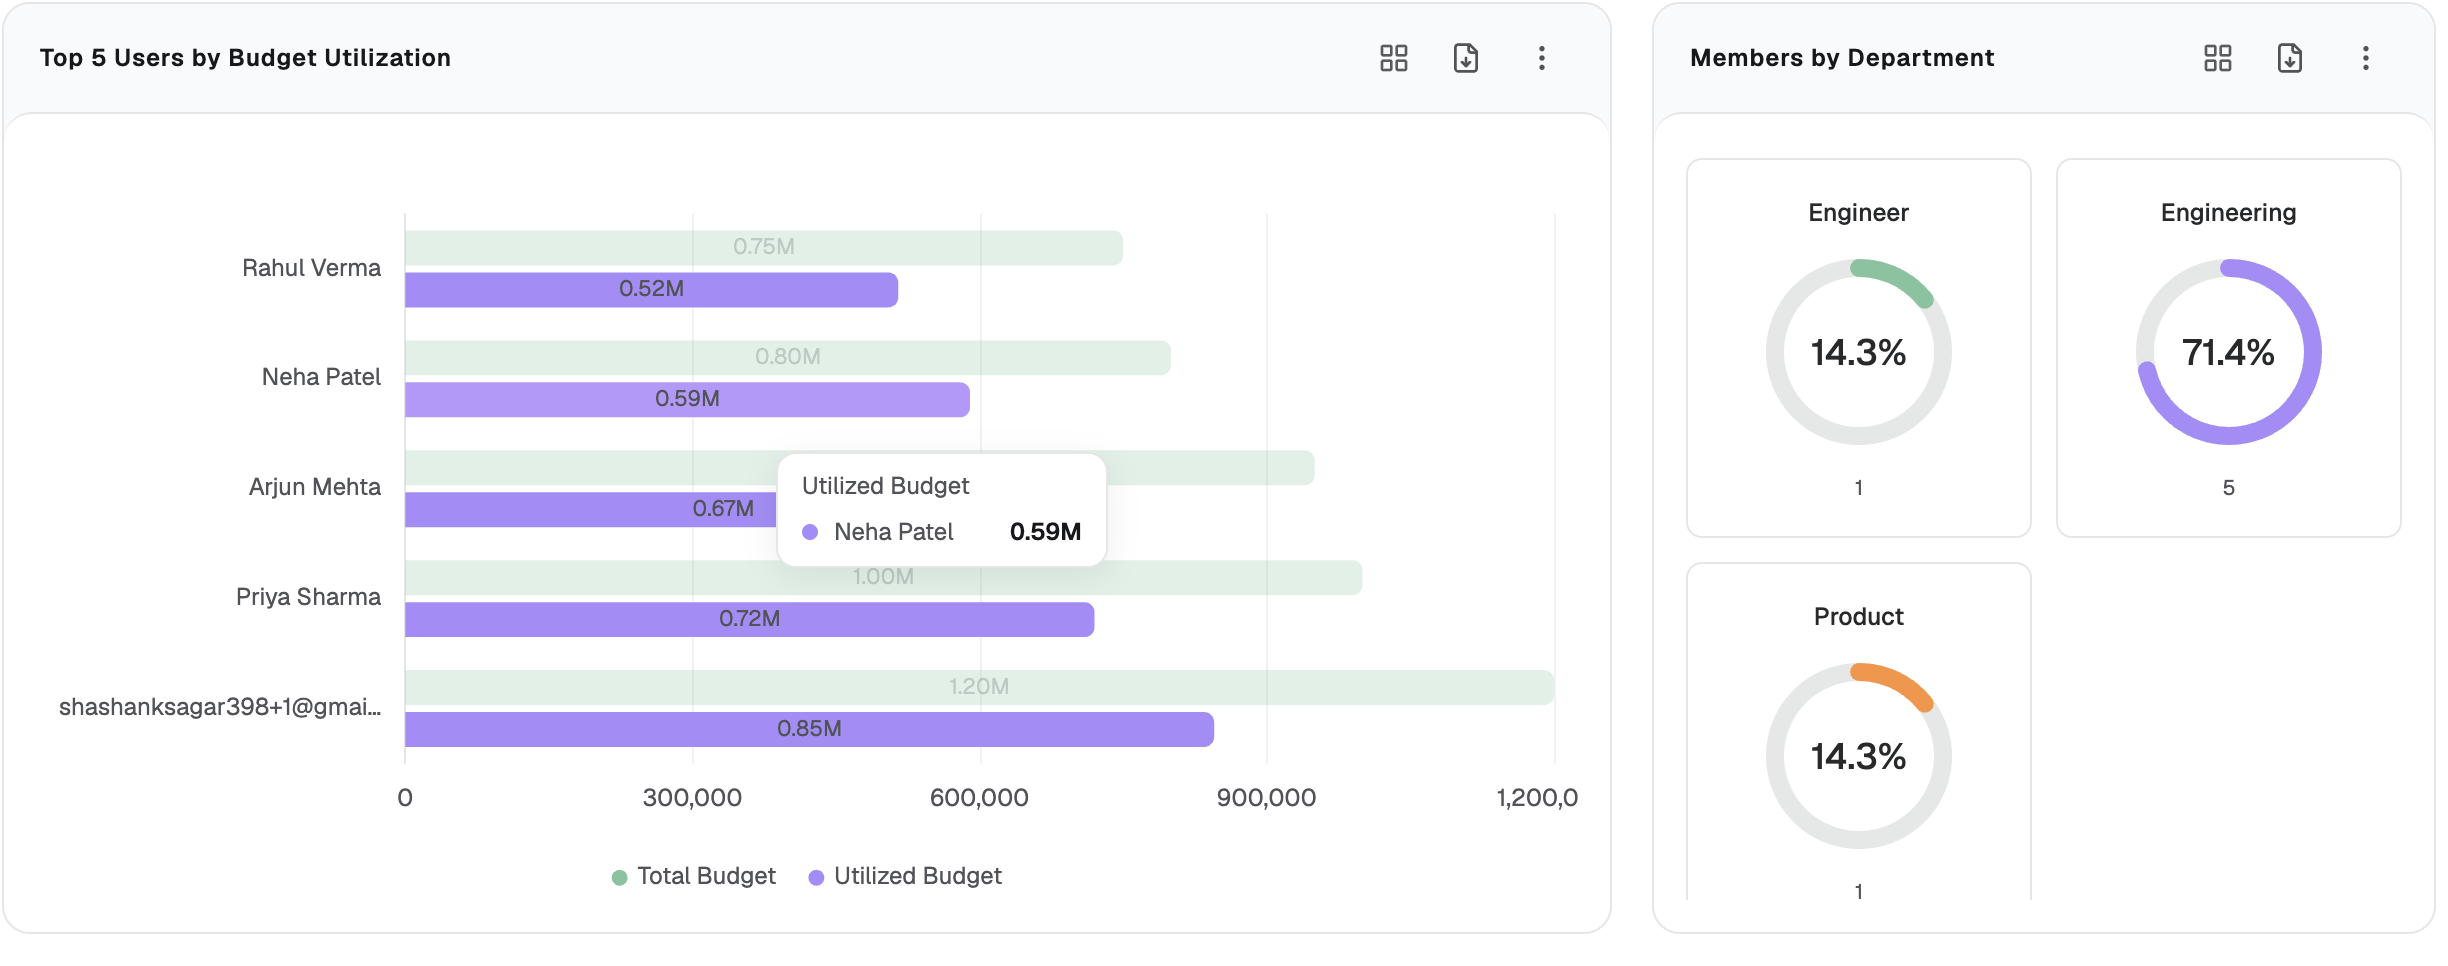
Top users and department headcount
From the user view you can see:
- The top five users by budget utilization, across departments
- For each department, how many people are actually using the models